

Article
Surface Roughness Measurements by AFM, Stylus and Optical Profilometry
Surface roughness helps researchers and engineers assess how a surface or component will perform, particularly when it interacts with another surface. It influences friction and wear, optical appearance, thermal and electrical contact, lubrication retention, wettability and adhesion. These effects matter across semiconductor, materials science, automotive, aerospace, life sciences, pharmaceutical and medical-device applications, at nano-, micro- and macro-scales. This overview compares atomic force microscopy, stylus profilometry and optical profilometry, then introduces the areal roughness parameters used to describe their measurements.
Instrumentation
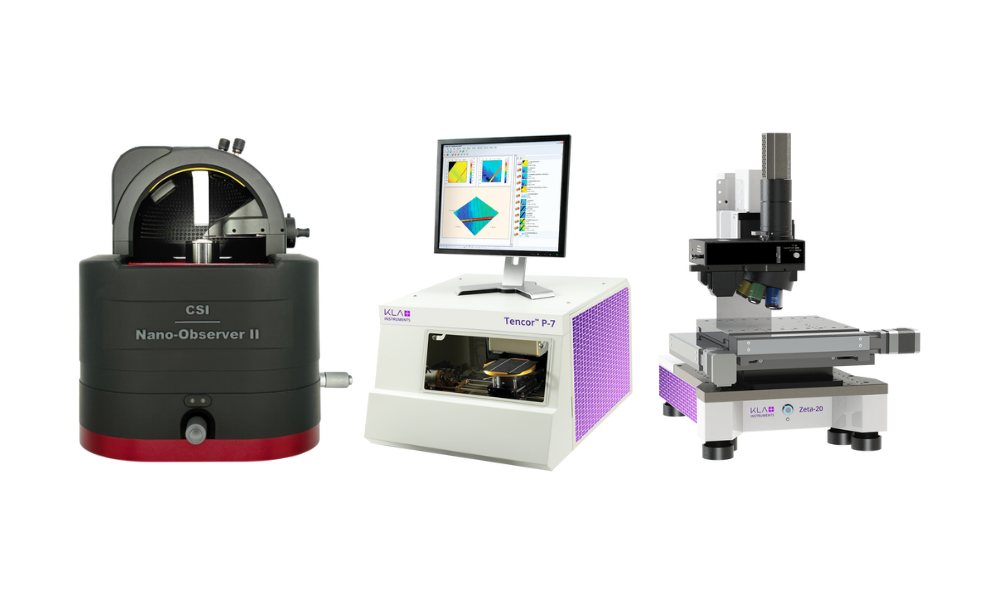
Three commonly used approaches are atomic force microscopy, stylus profilometry and optical profilometry. The following sections explain the operating principles and illustrate representative instruments and applications and summarise their advantages and limitations.
Atomic Force Microscopy (AFM)
An AFM uses a microfabricated cantilever, typically 100–200 µm long, with a sharp probe at its free end. The cantilever is held at an angle of 10–15°, and a laser beam reflected from it is directed onto a photodetector. Depending on the model and manufacturer, either the sample stage or the tip assembly moves in the x–y plane. Changes in cantilever deflection are detected as the probe traces the surface.
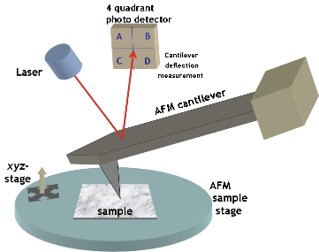
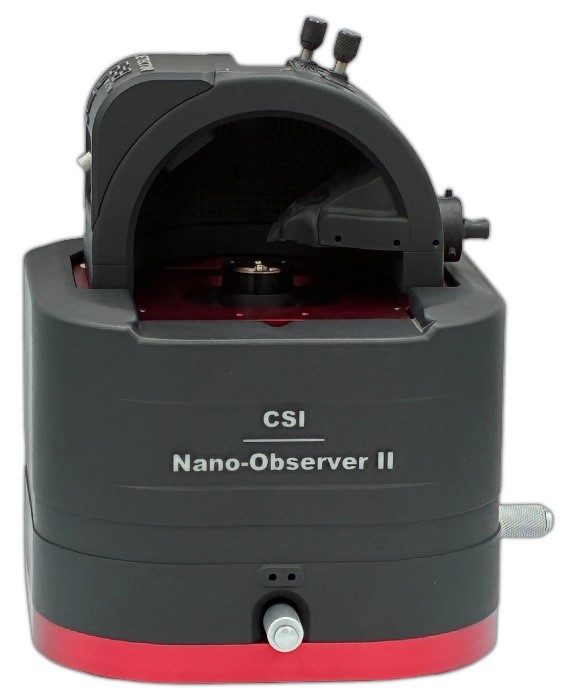
Figure 1 – (L) Generic schematic of an AFM (Open-Source Handbook of Nanoscience and Nanotechnology). (R) Nano-Observer II AFM from CSIsntruments.
The AFM has two main operating modes:
- Contact Mode: the probe is in physical contact with the sample surface, where feedback electronics track the surface with detection of variation of cantilever deflection.
- Oscillating Mode: the probe is oscillating at (or near) to its resonance frequency, only a few nanometers from the sample surface, the feedback electronics detect differences in the oscillation amplitude.
In addition to the sample surface topography, you can simultaneously measure other physical properties including friction, adhesion, mechanical stiffness (surface modulus), electrical fields, magnetic fields, conductivity/resistivity.
The Nano-Observer II can be operated under a variety of environmental conditions, including temperature- and humidity-controlled environmental chamber, temperature control (sample heater), and in aqueous solution (liquid cell)
Advantages
Very accurate at the nano-level with best resolution
Offers many characterization imaging modes (magnetic, electric, mechanical)
Max scan size depends on the instrument, but usually 100-200mm.
Large z-range – can measure up to ~15mm.
Disadvantages
Can be slow and often requires steady hand for cantilever exchange/laser alignment and patience
Limited sample geometry and vertical surface roughness range (max peak to valley roughness in the order of ~10mm)
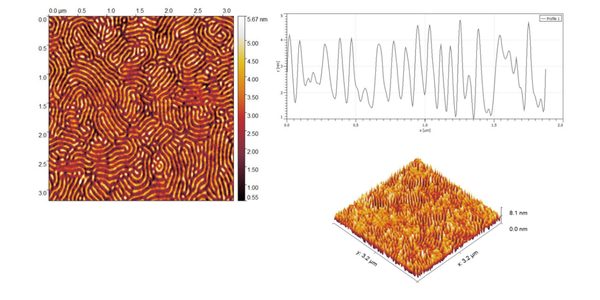
Figure 2 - Example dynamic mode image (3 x 3mm) of AFM on a copolymer blend on a silicon substrate, with corresponding line profile and 3D representation of the surface, with an Sa = 0.9nm and Sq=1.1nm
Stylus Profilometry
Stylus profilometry measures surface topography by drawing a precision stylus across a sample and converting its vertical motion into digital height and roughness data. The stylus is often diamond-tipped, with its geometry (cone angle, tip radii) influences lateral resolution. Modern profilers support two- and three-dimensional measurements, with viewing optics for locating features and automated analysis for evaluating them. These capabilities support surface-feature monitoring in semiconductor, data-storage and related production and quality-control applications.
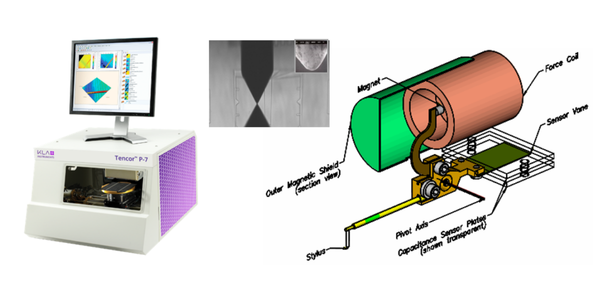
Figure 3 – (L) Tencor® KLA P-7 stylus profilometer (Middle) Stylus connected to pivot and tracking mechanism (R) Side view camera of stylus on surface (inset) SEM image of stylus (2mm radius, 60˚inclided angle)
Stylus profilometers convert vertical stylus motion into an electrical signal that represents surface topography. Most stylus profiler design use a linear variable differential transformer (LVDT), whose output changes as the stylus moves. The KLA Tencor® P-7 instead uses a capacitive sensor: a vane attached to the stylus arm moves between two capacitor plates, and the resulting capacitance change tracks displacement. This particular instrument design supports stable, high-resolution measurement across the stated vertical range.
Advantages
Larger lateral (300mm) and vertical range (~1mm) than AFM
Handles large sample geometries like up to 8-inch wafers
Can offer 3D stress measurements for before/after treatment of wafers
Disadvantages
Stylus can scratch sensitive and soft surfaces – (higher contact load than AFM)
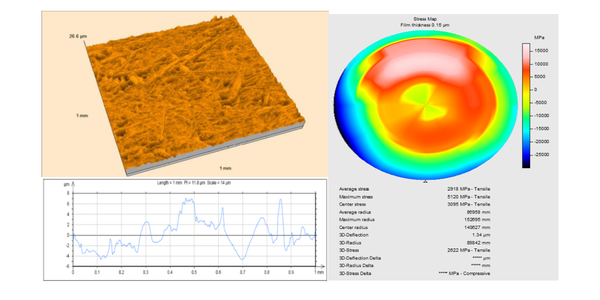
Figure 4 – A 1 x 1mm square map of piece of paper, with roughness parameters and arbitrary line profile underneath. (Right) Calculated stress map over the surface of silicon wafer due to the processing step.
Optical Profilometry
Surface imaging and profiling can be carried out via light for example using a while light interferometer (WLI). However, whilst WLI is a very useful technique, it does have some limitations (i.e. low reflectivity surfaces, high roughness surfaces, sensitive to vibrations, can’t handle multiple, transparent surfaces.)
The KLA Zeta™-20 with ZDot™ technology overcomes these limitations and can image very rough surfaces as well as low reflectivity surfaces such as solar cells. A structured illumination grid is projected on the surface, as has its maximum contrast at the confocal plane. The maximum contrast as a function of z-position (vertical) is used to map the surface topography accurately. A second LED illumination that does not go through the structured illumination is used to get the true colour from the image.
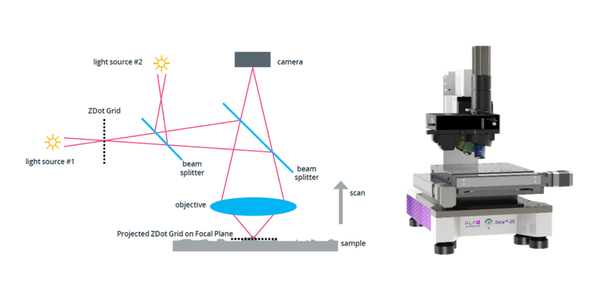
Figure 5 – ZDot™ schematic overview (R) Zeta™-20 optical profilometer KLA.
The Zeta-20 instrument not only measures a large range of surface topography from nanometers to millimeters, but it can be used to examine sub-surface metrology for optically transparent surfaces. Microfluidic channels depths can be commonly measured using Zeta 20, where the three surfaces of interest are readily detected as the upper/lower surface of the glass cover slip, plus the surface of the microfluidic channel.
Advantages
Vertical resolution is enhanced by ZDot technology and capable of ~13nm.
Largest vertical measuring range (13nm to 25mm)
Stitching can be used to obtain high lateral resolution over a wider area
Fastest imaging – non-contact imaging
Sub-surface metrology, in optically transparent materials
Disadvantages
Lateral resolution limited to wavelength of light
Can be affected by sample tilt and sharp slopes
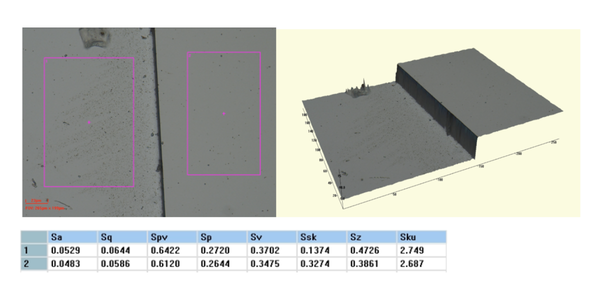
Figure 6 – (Left) 2D image of a step height reference sample, FoV 265 x 199mm, with two area boxes, with roughness report highlighting the lower step (box 1) has higher roughness parameters than the higher step (box 2). (Right) 3D representation of the step height feature.
Roughness Parameters
Surface roughness parameters quantify the small-scale peaks, valleys and texture associated with machining, grinding, polishing, coating and other finishing processes. Instrument software can calculate parameters from either two-dimensional profiles or three-dimensional surface measurements. This section discusses only three-dimensional, or areal, roughness parameters. For complete definitions and calculation procedures, refer to the relevant ISO standards and the metrology software documentation.
3D (Areal) Roughness Parameters (ISO 25178)
These 3D surface roughness parameters analyze the entire surface area, providing a more comprehensive and statistically robust overview. This parameter is often recommended if your surface has a highly directional textured surface from processes like turning, milling, extruded etc. 2D profiling.
- Sa (Areal Arithmetic Mean Height): This is probably the most used roughness parameter. Sa is the arithmetic mean of absolute height deviations from the mean plane across the evaluation area. It expresses average height variation over the measured surface.
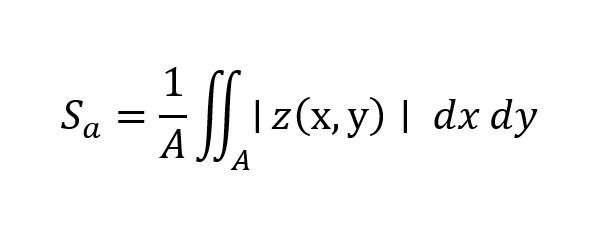
where A is the scan region/area, and z(x,y) is the height deviation from the mean plane.
- Sq (Areal Root Mean Square): Sq is the root mean square of the height deviations from the mean plane across the evaluation area. Because the deviations are squared in the calculation, larger deviations have more influence on Sq than on Sa.
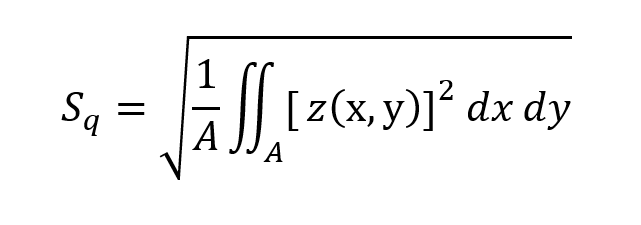
- Ssk (Areal Skewness) and Sku (Areal Kurtosis): Higher order statistical roughness parameters that describe the asymmetry and sharpness of the height distribution (unitless).
- Skewness is a cubic/third order calculation where a positive skew values of Ssk suggests that the surface has more high peaks and shallower valleys – which can lead to higher initial wear or an inadequate load distribution. Whereas negative skew values suggest that the surface has deeper valleys or pit features – this is often a useful feature for tribological reasons where lubrication trapping in the valleys is desirable.
- Kurtosis is a quartic/fourth order calculation, which describes the “tailedness” of the distribution of the heights relative to a Gaussian distribution. Surfaces that have Sku of 3 means that the surface exhibts a Gaussian normal distribution. Sku greater than 3 means that the surface has more extreme peaks, spiky features – often corroborating with higher frictional characteristics. Sku less than 3 means the surface has flatter surface with more uniform distribution of the height with a smoother characteristic.
- Sp, Sv, Sz: Extreme heights — maximum peak height (Sp) over the given surface, maximum valley or pit depth (Sv) over the surface, and total height Sz, where Sz = Sp + Sv.
| Measurement Technique | Vertical Resolution | Lateral Resolution | Maximum Scan Area | |
| AFM (Nano-Observer2) | Contact / Tapping Mode (physical probe tip scanning via laser cantilever deflection) | < 0.01 nm (sub-angstrom level) | Down to 1-2 nm (limited only by tip sharpness) | Typically 100 µm x 100 µm |
| Stylus Profiler (P-7) | Contact Stylus (physical diamond tip profiling via a capacitance displacement sensor) | ~0.01 nm to 0.06 nm (0.008 Å to 5.7 Å depending on scale range) | Limited by tip radius (typically 2.0 µm to 2.5 µm) | Up to 150 mm without stitching |
| Optical Profiler (Zeta-20) | Non-contact 3D Imaging (ZDot patented grid focus & multi-mode interferometry) | 10 nm to 15 nm |
~0.4 µm (diffraction limited by microscope objective optics) |
Large field of view fields, depending on objective. FoV for 5x objective |
Table 1 - Summary table, comparison of techniques.
Table 1 highlights the trade-off between fine-scale detail, surface coverage and sample interaction. AFM offers fine-scale surface characterisation and additional physical-property imaging; stylus profilometry extends the accessible measurement range but introduces a risk of scratching sensitive surfaces; optical profilometry provides non-contact imaging over wider fields, with limitations associated with lateral resolution, sample tilt and steep slopes.
The appropriate choice of instrumentation therefore depends largely on the sample, the features of interest and the required measurement coverage, rather than on a single specification.
Surface roughness measurement solutions from CN Tech
CN Tech supplies surface metrology and materials testing instrumentation for research and industry. Our portfolio includes atomic force microscopes, stylus profilometers and non-contact optical profilers, helping laboratories select an appropriate technique for their samples and measurement requirements.
From instrument selection through to installation, training and ongoing service, our team provides technical support to help you get the most from your measurement system.
Unsure which technique is right for your application? Contact us to discuss your sample material, expected surface roughness, feature dimensions and measurement goals.