Soft Intermittent Contact
Soft Intermittent Contact (Soft IC) Mode combines the advantages of Resonant Mode and Contact Mode in a single solution. This innovative technique provides accurate topography measurements while protecting both sample and tip from damage.
Key Features
- Simple force control using single parameter (deflection)
- Straightforward force calculation using Hooke's law
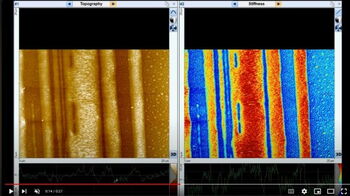
- Precise topography measurements
Manufacturer
CSI
CSInstruments is a French scientific equipment manufacturer specialised in the conception of Atomic Force Microscope and options designed for existing AFM (Nano-Observer AFM, Resiscope™, High Voltage Amplifier, Magnetic modules). The product range proposed by CSInstruments is designed and manufactured to help the scientific community to achieve nanometre performances that meet the research needs and requirements for actual and future nanoscience applications.
CSInstruments was founded by a team of experts working in AFM field for more than 20 years, starting as pioneer with some historical manufacturers. CSInstruments activity is also based on a qualified and dynamic team, experienced in the fields of mechanics, electronics and data processing. This expertise ensures innovation and performance in the production of AFM and achieves an excellent price/performance ratio!
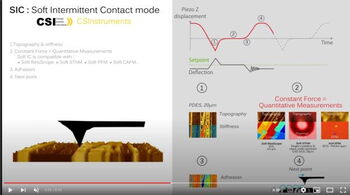
How does Soft Intermittent Contact Mode work?
Soft IC Mode operates through a controlled intermittent contact principle:
1. The probe approaches the sample surface
2. Brief, controlled contact is made
3. Force is calculated directly using deflection
4. The tip retracts and moves to the next point
5. Process repeats to create comprehensive topography map
Soft IC Mode
Soft IC - Resonant Mode Advantages:
-
Eliminates friction and shear forces
-
Reduces sample damage
-
Minimises tip wear
Soft IC - Contact Mode Benefits:
-
Direct force control
-
Simple force calculation
-
Straightforward operation
Advantages Over Traditional Methods
SOFT IC Compared to Contact Mode:
- Eliminates lateral forces
- Reduces sample damage
- Extends tip lifetime
SOFT IC Compared to Resonant Mode:
- Simpler force control (single parameter)
- Direct force calculation
- More straightforward operation
Soft Intermittent Contact : The 3rd AFM mode
- Combines precision of contact AFM with dynamic capabilities of resonant modes
- Ideal for delicate and soft materials
- Detailed mechanical and electrical measurements with minimal sample disturbance
- Soft Meka, Soft PFM, Soft ResiScope and Soft SThM
Soft Modes
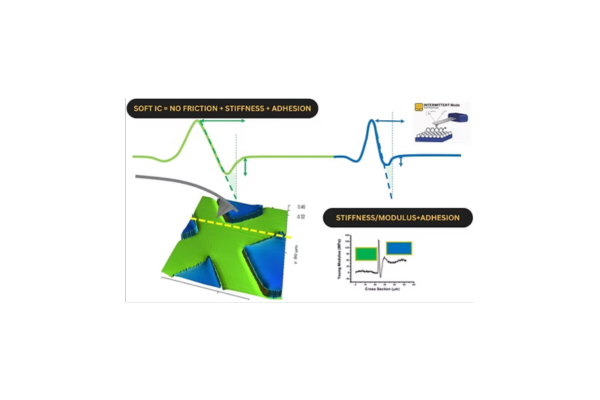
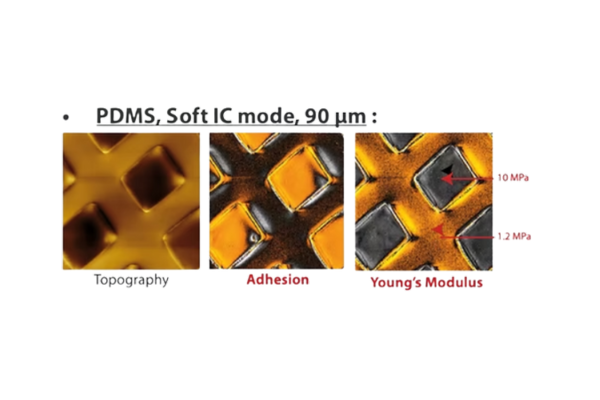
SOFT MEKA
Mechanical Properties Analysis:
- Extension of Soft IC mode for precise mechanical measurements
- High-resolution mapping capabilities
- Specially designed for soft/fragile samples
Key Capabilities:
- Precise stiffness mapping
- Detailed adhesion measurements
- Force curve analysisMechanical property extraction
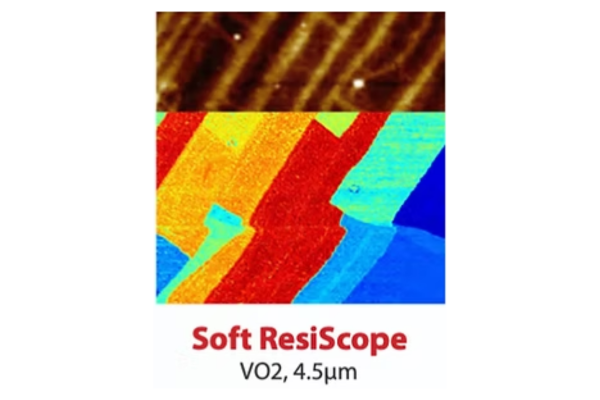
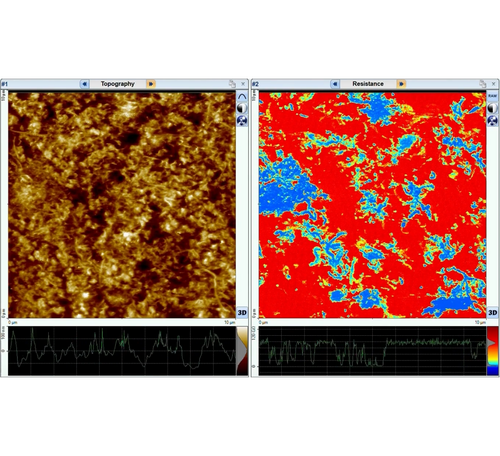
Soft ResiScope
Mechanical Properties Analysis:
- Extension of Soft IC mode for precise mechanical measurements
- High-resolution mapping capabilities
- Specially designed for soft/fragile samples
Key Capabilities:
- Precise stiffness mapping
- Detailed adhesion measurements
- Force curve analysis mechanical property extraction
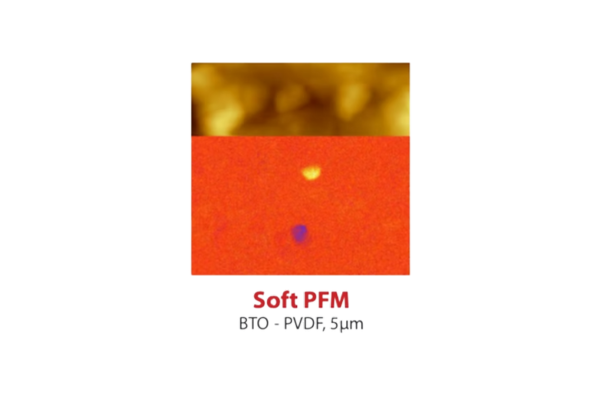
SOFT PFM
Piezoelectric Measurements:
- High-sensitivity piezo response detection
- Local polarisation mapping
- Domain structure analysis
- Minimal sample perturbation
Key Benefits:
- Enhanced sensitivity for weak piezo response
- Reduced tip and sample wear
- Better signal-to-noise ratio
- Compatible with sensitive materials
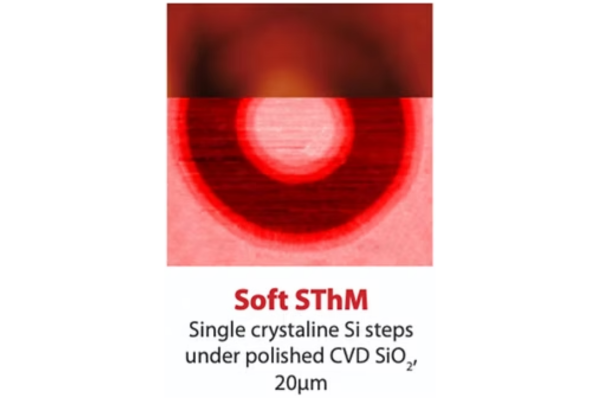
SOFT SThM
Thermal Analysis Features:
- Temperature mapping with nanoscale resolution
- Local thermal analysis
- Minimal thermal perturbation
Applications:
- Polymer characterisation
- Thermal interface materials
- Microelectronics inspection
- Biological samples
Specifications
| Measurement Range | 10² to 10¹² ohms |
| Compatibility | Nano-Observer AFM systems |
| Supported Modes | Intermittent contact |
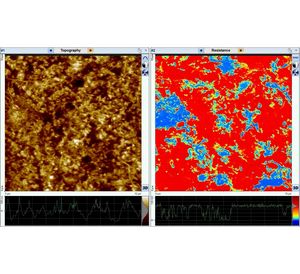
| Data Output | Simultaneous topography and electrical property mapping |
Applications
Materials Science
The Nano-Observer AFM series is tailored for materials science applications, delivering precise nanoscale analysis of surface morphology, mechanical properties, and electrical behaviour. Equipped with advanced techniques such as ResiScope and HD-KFM III, it supports the investigation of a wide range of materials, from nanocomposites to functional coatings. Ideal for both research and industrial development, it ensures reliable, high-resolution results to drive innovation in materials engineering.
Semiconductors
The Nano-Observer AFM series is a powerful tool for semiconductor research, offering unparalleled precision in surface morphology, electrical characterisation, and mechanical property analysis at the nanoscale. Utilising cutting-edge techniques such as HD-KFM III and ResiScope, it enables detailed studies of semiconductor materials, from advanced device fabrication to quality assurance. Designed for both research and industrial applications, it ensures accurate, high-resolution data to drive innovation in semiconductor technology.
Biology
The Nano-Observer AFM series provides exceptional capabilities for analysing biological samples, offering nanoscale insights into surface morphology, mechanical properties, and molecular interactions. With advanced techniques like Soft ResiScope and liquid imaging modes, it ensures precise characterisation of delicate biological structures, from cells to biomolecules. Designed for both research and applied science, it delivers reliable, high-resolution data essential for breakthroughs in biotechnology and life sciences.
Polymers
The Nano-Observer AFM series delivers high-precision polymer analysis, revealing surface morphology, mechanical properties, and electrical characteristics at the nanoscale. With advanced techniques like Soft ResiScope and HD-KFM, it supports applications from polymer development to quality control, ensuring reliable, high-resolution results for research and industry.
2D Materials
The Nano-Observer AFM series is a cutting-edge solution for the analysis of 2D materials like graphene, hBN, and transition metal dichalcogenides. It offers unparalleled precision in characterizing surface morphology, mechanical properties, and electrical behavior at the nanoscale. With advanced modes such as HD-KFM III and ResiScope, it enables detailed investigations of these materials' unique properties, supporting both fundamental research and industrial development in nanotechnology and advanced material applications.
Energy Materials
The Nano-Observer AFM series excels in the analysis of renewable energy materials, offering high-precision characterisation of surface morphology, electrical properties, and mechanical behaviour at the nanoscale. With advanced techniques like HD-KFM III and ResiScope, it is ideal for studying photovoltaics, battery materials, and energy storage systems. Supporting both research and industrial applications, it provides reliable, high-resolution data to accelerate innovation in sustainable energy technologies.
Videos
Soft Intermittent Contact | Principles
Soft Intermittent Contact | The advantages of contact and resonant AFM modes without the drawbacks
Related Products
Service Support
Comprehensive repairs and servicing
Annual Support Programs
Your metrology instrumentation is a major investment that is critical to your business operation and success. In today’s competitive climate, it is more important than ever to extend the functionality and peak performance of your metrology equipment years beyond the expiration of your factory warranty. CN Tech’s Support Programs will help ensure that your investment is protected, and that you and your instrument’s are always operating at peak performance.
With over 20 years’ experience servicing and repairing you can be assured that your system is in safe hands. The independent services we offer include system relocation, maintenance visits, parts and consumables, and break down interventions.
CN Tech’s Support Programs are an economical way to guarantee optimal working condition:
- Annual Preventive Maintenance
- Priority Technical Assistance
- Preferred Parts Availability
- On-Site User Training
- Remote Diagnostics
- No surprise repair expense and much more!
Support Contact Example
An example of our service and support contracts are shown below:
Metrology & Instrumentation Annual Support Programs 2024/25
CN Tech's Support Programs will help ensure that your investment is protected, and that you and your instrument’s are always operating at peak performance.